Background
The controlling factor of spectroscopy solutions is the range of electromagnetic spectrum being analyzed. Different portions of the electromagnetic spectrum faces different challenges optically – leading to a wide range of devices based on the application of the process involved. In this tutorial, we consider the possible solutions for studying the entire electromagnetic spectrum.
Breakdown by Wavelength
Electromagnetic Spectrum | Wavelength | Available Measurement Tools |
SXR | ~1nm | SXR/VUV/XUV Spectrometers |
Extreme ultraviolet | ~10nm |
Near Ultraviolet | ~100nm |
Ultraviolet | ~200nm | Fiber Spectrometers Real Time Imaging Spectrometers1 Hyperspectral Cameras |
Visible | ~400nm to 750nm |
NIR | ~750nm to 2500nm |
Infrared | >2500nm | Hyperspectral Cameras Infrared Cameras2 |
1Imaging spectrometer for beam profiling.
2Not a spectrometer, relevant for Monitoring Systems.
We study specific use cases for Hyperspectral Imaging, Mini Imaging Spatial Spectrometers and Fiber Spectrometers.
Hyperspectral Imaging
 Hyperspectral imaging systems are imaging spectrometer systems that record chemical or physical information precisely and reliably in real time. The spectral data can be evaluated by means of a chemometric data analysis and thus enable reliable classifications or quantifications. The 4 cameras available cover applications from the Visible (VIS), Near Infrared (NIR), Short wave Infrared (SWIR), Mid-wave Infrared (MWIR) hyperspectral imaging.
Applications of Hyperspectral Imaging
- Agriculture Monitoring – The use of Hyperspectral Imaging for chemical analysis and crop quality monitoring.
- Industrial/Manufacturing Monitoring – Passive chemical detection, Material detection and identification and Environmental Emissions.
- Industrial and Lab based detection inspection of samples.
Further Reading: Incorporating Hyperspectral Imaging Information for Data Driven Applications
Full Spectrum Coverage
Spectrum | Wavelength Spectrum | Frame Rate | Model | Key specifications |
Visible | 400 to 1000nm | Up to 54 fps full resolution (8 bit) | Green Eye | Comprehensive background information and technical web data are available on our website.Click here |
NIR | 950 to 1700nm or 1200-2200nm | 330 fps (full frame) / 4200 fps (4 bands) | Red Eye |
MWIR | 2900 to 4200nm | 383 Hz @ integration time < 2.6ms | Black Eye |
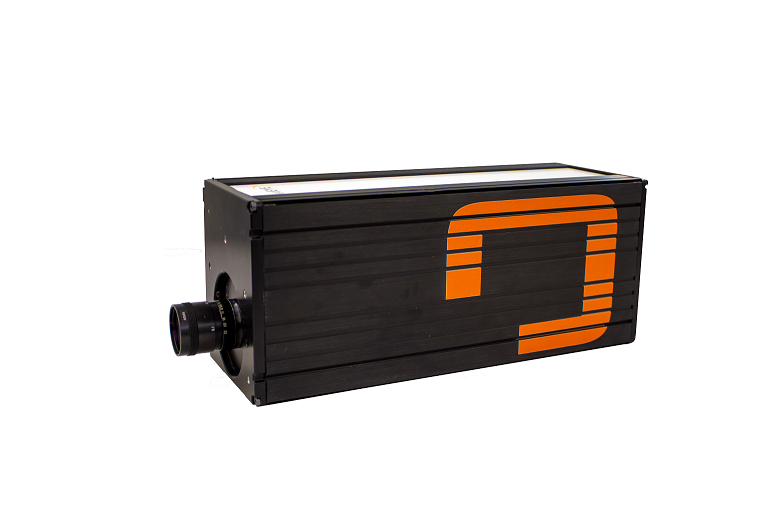
Hyperspectral Imaging Camera
Beam Characterization Imaging Spectroscopy
Real Time Beam Characterization for ultrafast lasers
The Imaging spatial spectrometer provides spatial information about the input beam and spectral information about the source, making it a useful beam characterization tool for free space sources. Capable of taking single-shot measurements, the imaging spatial spectrometer is useful for a extremely wide range of experiments where precision and accuracy of the beam is key.
.png)
(a) Integrated software for real time monitoring. (b) Measuring only 101 x 101 x 52mm, the Mini Imaging Spectrometer is designed for integrated use with preexisting optical setups.
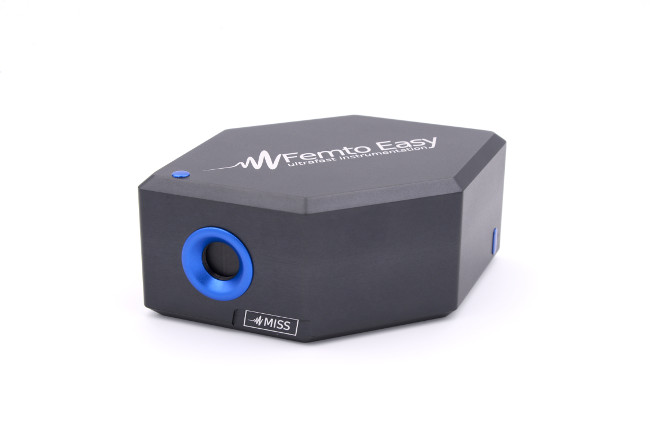
Mini Imaging Spatial Spectrometer
As the name suggests, the Mini Imaging spatial spectrometer provides spatial information about the input beam and spectral information about the source, making it a useful beam characterization tool for free space sources. The “Mini” part of the design was a deliberate design consideration for integration into setups to provide an extra check for processes where beam characteristics is a specific requirement. Catered to wavelengths ranging between 240nm and 1100nm for beam diameter up to 12.7mm.
Mini Imaging Spatial Spectrometers
Fiber Spectrometers: UV-VIS-NIR Spectroscopy
This group of spectrometers typically cover the Ultraviolet to NIR region of the electromagnetic spectrum (200nm to 2500nm) over a varying range of devices. A CCD is used to analyze the resulting light sample, breaking the sample down into respective wavelengths. Fitted with a SMA905 input, and an easy-to-use software for data analysis, this spectrometer is easily adoptable for education, industrial processes, and research.
Factors affecting Optical Resolution
Slit Size and Gratings
The factors including the choice of spectrometer typically revolves around slit size (the bigger the slit permitting more-light to enter) and the grating used. The slit and grating determine the optical resolution of the spectrometer, allowing for a variance in resolution depending on cost and application needs.
Wavelength Range and Optical Resolution
Spectrum | UV | VISIBLE | NIR |
General Purpose Spectroscopy |
| 200nm |
|
|
| 1100nm |
|
|
|
High Resolution Spectroscopy |
| 200nm |
|
|
| 1100nm |
|
|
|
Cooled - Series |
| 200nm |
|
|
| 1100nm |
|
|
|
NIR Series |
|
|
|
|
| 900nm |
| 2500nm |
|
|
|
|
| 900nm | 1700nm |
|
Wavelength ranges are selectable and affects the final optical resolution with smaller wavelength ranges achieving higher optical resolution. Spectrometers with coverage from 200-1100nm offer resolution of 0.8nm compared to a spectrometer covering 365-700nm which has a resolution of 0.36nm for the same slit size.
Spectrometer Categories
General Purpose Spectrometers
General purpose Spectrometers are spectrometers with optical resolutions suitable for general sample analysis (~0.8nm with 10um slit for). Spectral coverage typically includes Ultraviolet, visible and Near Infrared spectrums with smaller spectral coverage resulting in better resolution. This makes the General-Purpose Spectrometer suitable for industrial applications such as Quality checks, industrial inspection, and study of biological sample. Integration to more complex setups involve microscopy are also available.
High Resolution spectrometers
Optical resolution: 0.21nm with 10um slit. Similar to the General-purpose spectrometers, the High-resolution spectrometers adopt better gratings and cover a smaller wavelength range, allowing for a significantly higher optical resolution and better results.
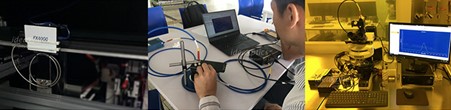
(a) Passive collection of data from a metamaterials lab exploring the visible spectrum. (b) Portable inspection for outdoor use in studying samples retrieved from the field. (c) Microscope integrated Spectroscopy setup for sample study – useful for cleanroom or biological samples.
Near Infrared Spectroscopy
Near Infrared spectrometers a different portion of the wavelength and come with TEC system incorporated into the CCD for noise minimization and better signal to noise ratio. Catering to applications with the corresponding wavelength spectrum NIR spectroscopy allows for the study of fields including but not limited to material science (for measurement, identification of optical properties, study of nanoparticles), FTIR, and identification of samples.
Purpose built spectrometers for advance techniques: Raman Spectroscopy and Angular Resolved Spectroscopy
Spectrometers for specialized applications are designed to be able to observe specific optical properties and changes to a sample. We provide for this by our NOVA cooled series which has a cooled 2d CCD array with peak quantum efficiency at 95% with an excellent signal to noise ratio suitable for Angular-Resolved Spectroscopy and Fluorescence/ Raman Spectroscopy.
Fiber Spectrometers
Conclusion
Explore our knowledge base further or check out our System Solutions where we discuss advanced topics and applications. Have a question? We are supported by a team of PhDs and Industrial experts. Drop us an e-mail at info@simtrum.com.
Join the conversation: Interested in a specific topic? Follow us on Linkedin to chat and participate in polls.