|
|
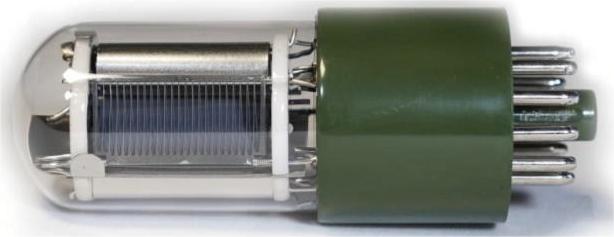 |
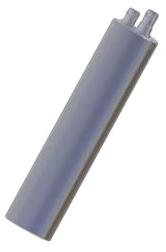
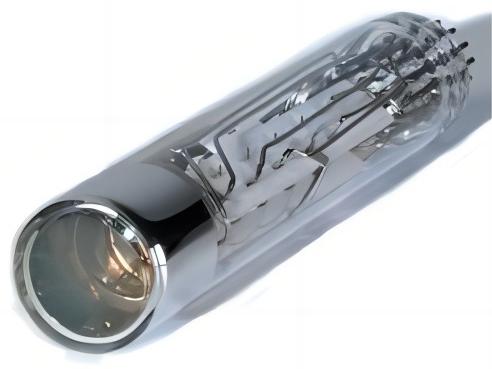
LA-BY01-Tube-S1-01
Spectral range:165-900nm;Photocathode Luminous Sensitivity:Min 140 μA/lm(Typ:250μA/lm); Anode Luminous Sensitivity:Min 1400 A/lm(Typ:2500A/lm); Gain:1*10^7; Dark current:Typ:3 nA(Max:50nA);
|
|
6-8 weeks |
Request for quote |
|
|
|
|
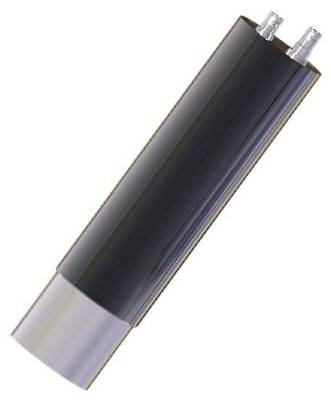
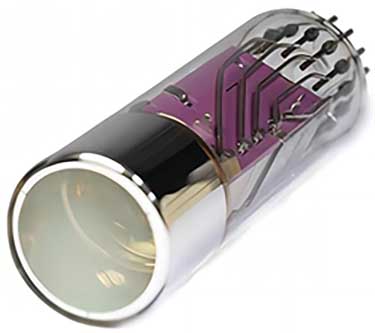
LA-BY01-Tube-S1-02
Spectral range:165-900nm;Photocathode Luminous Sensitivity:Min 140 μA/lm(Typ:250μA/lm); Anode Luminous Sensitivity:Min 1500 A/lm(Typ:2000A/lm); Gain:8*10^6; Dark current:Typ:3 nA(Max:50nA);
|
|
6-8 weeks |
Request for quote |
|
|
|
|
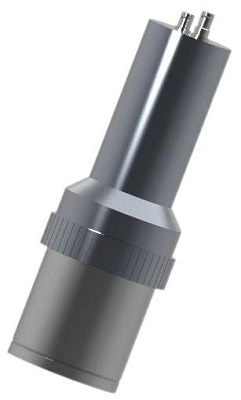
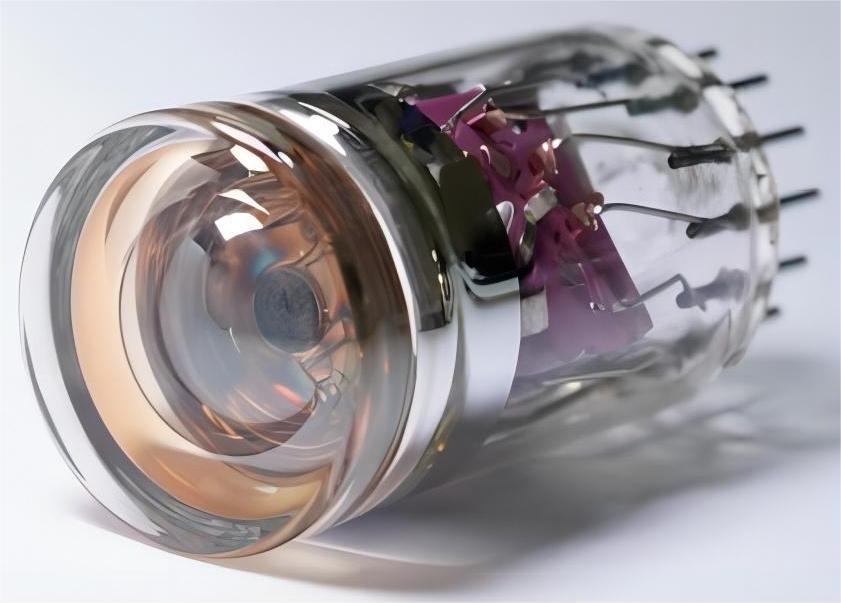
LA-BY01-Tube-S1-03
Spectral range:165-870nm;Photocathode Luminous Sensitivity:Min 80 μA/lm(Typ:150μA/lm); Anode Luminous Sensitivity:Min 300 A/lm(Typ:500A/lm); Gain:3.3*10^6; Dark current:Typ:3 nA(Max:50nA);
|
|
6-8 weeks |
Request for quote |
|
|
|
 |
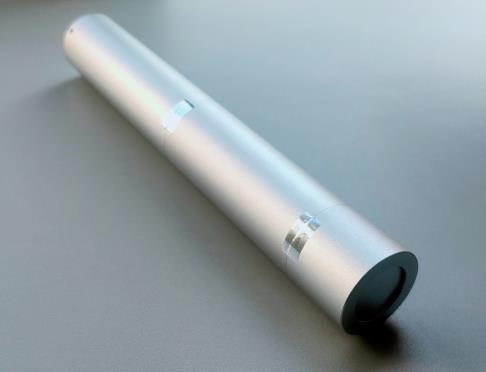
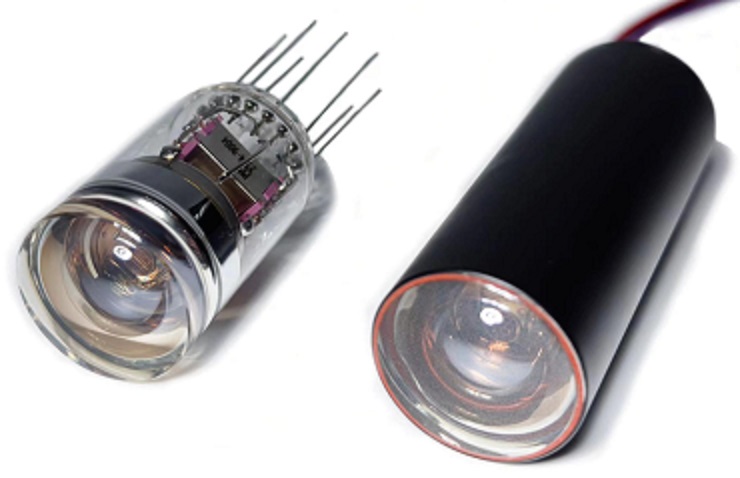
LA-BY01-Tube-S2-01
Spectral range:165-650nm;Photocathode Luminous Sensitivity:Min 50 μA/lm(Typ:70μA/lm); Anode Luminous Sensitivity:Min 1000 A/lm(Typ:1500A/lm); Gain:2*10^7; Dark current:Typ:0.8 nA(Max:3nA);
|
|
6-8 weeks |
Request for quote |
|
|
|
|
LA-BY01-Tube-S2-02
Spectral range:165-650nm;Photocathode Luminous Sensitivity:Min 50 μA/lm(Typ:70μA/lm); Anode Luminous Sensitivity:Min 500A/lm(Typ:800A/lm); Gain:1*10^7; Dark current:Typ:0.8nA(Max:3nA)
|
|
6-8 weeks |
Request for quote |
|
|
|
|
LA-BY01-Tube-S2-03
Spectral range:165-650nm;Photocathode Luminous Sensitivity:Min 50 μA/lm(Typ:70μA/lm); Anode Luminous Sensitivity:Min 1000A/lm(Typ:1500A/lm); Gain:2*10^7; Dark current:Typ:3nA(Max:7nA);
|
|
6-8 weeks |
Request for quote |
|
|
|
|
LA-BY01-Tube-S2-04
Spectral range:165-650nm;Photocathode Luminous Sensitivity:Min 25μA/lm(Typ:50μA/lm); Anode Luminous Sensitivity:Min 200A/lm(Typ:500A/lm); Gain:1*10^7; Dark current:Typ:3nA(Max:7nA
|
|
6-8 weeks |
Request for quote |
|
|
|
|
LA-BY01-Tube-S2-05
Spectral range:165-650nm;Photocathode Luminous Sensitivity:Min 25μA/lm(Typ:40μA/lm); Anode Luminous Sensitivity:Min 200A/lm(Typ:400A/lm); Gain:1*10^7; Dark current:Typ:7nA(Max:50nA)
|
|
6-8 weeks |
Request for quote |
|
|
|
|
LA-BY01-Tube-S2-06
Spectral range:300-650nm;Photocathode Luminous Sensitivity:Min 50 μA/lm(Typ:70μA/lm); Anode Luminous Sensitivity:Min 1000A/lm(Typ:1400A/lm); Gain:2*10^7; Dark current:Typ:0.8nA(Max:3nA)
|
|
6-8 weeks |
Request for quote |
|
|
|
|
LA-BY01-Tube-S2-07
Spectral range:300-650nm;Photocathode Luminous Sensitivity:Min 50 μA/lm(Typ:70μA/lm); Anode Luminous Sensitivity:Min 500A/lm(Typ:700A/lm); Gain:1*10^7; Dark current:Typ:0.8nA(Max:3nA)
|
|
6-8 weeks |
Request for quote |
|
|
|
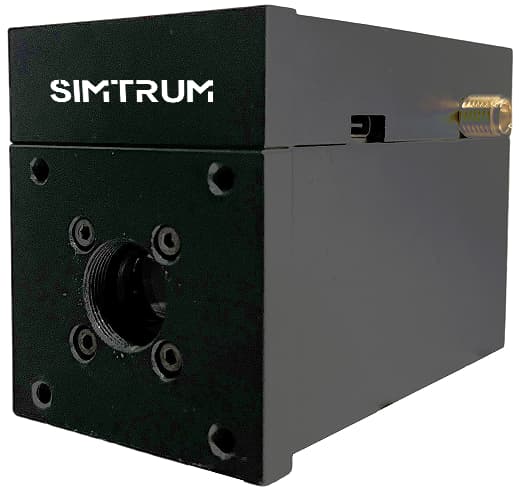 |
SIM-PMT-BK-400
Detection area:Ø8mm;wavelength range:230~700nm;peak wavelength:400nm;dark current:1nA;Cathode radiation sensitivity:110mA/W,Cathode quantum efficiency:34.10%;Anodic radiation sensitivity:2.6*10^5A/W;gain:2.36*10^6
|
|
16-18 weeks |
$1843.00 |
|
|
|
|
SIM-PMT-BK-400(UV)
Detection area:Ø8mm;wavelength range:185~700nm;peak wavelength:400nm;dark current:1nA;Cathode radiation sensitivity:110mA/W,Cathode quantum efficiency:34.10%;Anodic radiation sensitivity:2.6*10^5A/W;gain:2.36*10^6
|
|
16-18 weeks |
$2774.00 |
|
|
|
|
SIM-PMT-MK-400
Detection area:Ø8mm;wavelength range:230~870nm;peak wavelength:400nm;dark current:1nA;Cathode radiation sensitivity:77mA/W,Cathode quantum efficiency:23.87%;Anodic radiation sensitivity:1.5*10^5A/W;gain:1.95*10^6
|
|
16-18 weeks |
$2745.00 |
|
|
|
|
SIM-PMT-MK-400(UV)
Detection area:Ø8mm;wavelength range:185~870nm;peak wavelength:400nm;dark current:1nA;Cathode radiation sensitivity:77mA/W,Cathode quantum efficiency:23.87%;Anodic radiation sensitivity:1.5*10^5A/W;gain:1.95*10^6
|
|
16-18 weeks |
$2802.00 |
|
|
|
|
SIM-PMT-MK-630
Detection area:Ø8mm;wavelength range:300~920nm;peak wavelength:630nm;dark current:10nA;Cathode radiation sensitivity:78mA/W,Cathode quantum efficiency:15%;Anodic radiation sensitivity:7.8*10^4A/W;gain:1*10^6
|
|
16-18 weeks |
$3189.00 |
|
|
|
|
SIM-PMT-BK-420
Detection area:Ø25mm;wavelength range:300~650nm;peak wavelength:420nm;dark current:1nA;Cathode radiation sensitivity:80mA/W,Cathode quantum efficiency:24%;Anodic radiation sensitivity:2.5*10^3A/W;gain:3.13*10^4
|
|
16-18 weeks |
$5556.00 |
|
|
|
|
SIM-PMT-GAP-520
Detection area:Ø5mm;wavelength range:300~740nm;peak wavelength:520nm;dark current:3nA;Cathode radiation sensitivity:189mA/W,Cathode quantum efficiency:45%;Anodic radiation sensitivity:3.8*10^5A/W;gain:2*10^6
|
|
16-18 weeks |
$6487.00 |
|
|
|
 |
STN6011
Microchannel Plate - Photomultiplier, Spectral Response 115-320nm, Quantum Efficiency Peak Wavelength Typ. 250nm, QE Typ. 15%@250nm, Radiant Sensitivity Typ. 30mA/W@250nm, Supply Voltage Typ.1800V, Gain 1×10^6, Dark Count Rate@0.2pe Typ. 500Hz, Rise Time Typ.1.2ns
|
|
6-8 weeks |
Request for quote |
|
|
|
 |
STN6012
Microchannel Plate - Photomultiplier, Spectral Response 290-650nm, Quantum Efficiency Peak Wavelength Typ. 380nm, Luminous Sensitivity Typ. 70μA/lm, QE @410nm Typ. 22%, Supply Voltage Typ.2500V, Gain Typ.1 × 10^6, Dark Count Rate@0.2pe Typ.1000Hz, Rise Time Typ.180ps
|
|
6-8 weeks |
Request for quote |
|
|
|
|
STN6014
Microchannel Plate - Photomultiplier, Spectral Response 290-650nm, Quantum Efficiency Peak Wavelength Typ. 380nm, QE Typ. 22@410nm, Luminous Sensitivity Typ. 70μA/lm, Radiant Sensitivity Typ. 72mA/W@410nm, Supply Voltage Typ.1800V, Gain 1×10^6, Dark Count Rate@0.2pe Typ. 1000Hz, Rise Time Typ.1.2ns
|
|
6-8 weeks |
Request for quote |
|
|
|
 |
STN6015
Microchannel Plate - Photomultiplier, Spectral Response 290-650nm, Quantum Efficiency Peak Wavelength Typ.380nm, Luminous Sensitivity Typ. 70μA/lm, QE @410nm Typ. 22%, Radiant Sensitivity@410nm Typ. 72mA/W, Supply Voltage Typ. 1700, Gain 1×10^6, Dark Count Rate@0.2pe(Single Anode) Typ. 1000Hz, Rise Time 250ps
|
|
6-8 weeks |
Request for quote |
|
|
|
 |
STN6021
Microchannel Plate - Photomultiplier, Spectral Response 290-650nm, Quantum Efficiency Peak Wavelength Typ.380nm, Luminous Sensitivity Typ. 70μA/lm, QE @410nm Typ. 22%, Radiant Sensitivity@410nm Typ. 72mA/W, Supply Voltage Typ.2500V, Gain 2×10^6, Dark Count Rate@0.2pe(Single Anode) Typ. 500Hz, Rise Time 300ps
|
|
6-8 weeks |
Request for quote |
|
|
|
 |
STN6082
Microchannel Plate - Photomultiplier, Diameter 8", Spectral Range 290-650nm, QE Peak Wavelength Typ. 380nm, Photocathode Integral luminious Typ. 90A/lm, @410nm/QE Typ. 30%, Supply voltage Typ.1750V, Gain Typ. 1×10^7, Anode Sensitivity 900A/lm, Rise Time 4ns
|
|
6-8 weeks |
Request for quote |
|
|
|
|
STN6201
Microchannel Plate - Photomultiplier, Diameter 20", Spectral Range 290-650nm, QE Peak Wavelength Typ. 380nm, Photocathode Integral luminious Typ. 90A/lm, @410nm/QE Typ. 30%, Supply voltage Typ.1750V, Gain Typ. 1×10^7, Anode Sensitivity 900A/lm, Rise Time 1.4ns
|
|
6-8 weeks |
Request for quote |
|
|
|
|
STN6203
Microchannel Plate - Photomultiplier, Diameter 20", Spectral Range 290-650nm, QE Peak Wavelength Typ. 380nm, Photocathode Integral luminious Typ. 90A/lm, @410nm/QE Typ. 30%, Supply voltage Typ.1900V, Gain Typ. 1×10^7, Anode Sensitivity 900A/lm, Rise Time 1.4ns
|
|
6-8 weeks |
Request for quote |
|
|
|
 |
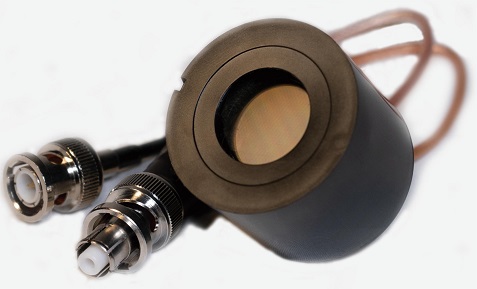
STM3111
Scintillator Probe, Application Voltage 0~+1250V, PMT Diameter 1", Effective Size of Scintillator Φ25×25mm, Interface Type BNC SHV, Energy Resolution ≤8.5%,
|
|
6-8 weeks |
Request for quote |
|
|
|
 |
STM3112
Scintillator Probe, Application Voltage 0~+1250V, PMT Diameter 2", Effective Size of Scintillator Φ50×50mm, Interface Type BNC SHV, Energy Resolution ≤8.5%,
|
|
6-8 weeks |
Request for quote |
|
|
|
 |
STM3113
Scintillator Probe, Application Voltage 0~+1250V, PMT Diameter 3", Effective Size of Scintillator Φ75×75mm, Interface Type BNC SHV, Energy Resolution ≤8.5%,
|
|
6-8 weeks |
Request for quote |
|
|
|
 |
STM3021
Nal Scintillator Detector, Input Voltage +11.5~+12.5V, Max.Input Current 50mA, Effective Size of Scintillator Φ25×25mm, Output Signal Polarity Negative, Output Signal Amplitude 1V, Output Signal Amplitude 6V, Energy Resolution ≤8.5%
|
|
6-8 weeks |
Request for quote |
|
|
|
 |
STM3022
Nal Scintillator Detector, Input Voltage +11.5~+12.5V, Max.Input Current 50mA, Effective Size of Scintillator Φ50×50mm, Output Signal Polarity Negative, Output Signal Amplitude 1V, Output Signal Amplitude 6V, Energy Resolution ≤8.5%
|
|
6-8 weeks |
Request for quote |
|
|
|
 |
STM3023
Nal Scintillator Detector, Input Voltage +11.5~+12.5V, Max.Input Current 50mA, Effective Size of Scintillator Φ75×75mm, Output Signal Polarity Negative, Output Signal Amplitude 1V, Output Signal Amplitude 6V, Energy Resolution ≤8.5%
|
|
6-8 weeks |
Request for quote |
|
|
|
 |
STM1111
β Detector, Input Voltage +11.5~ + 12.5V, Max Input Current 70mA, Effective Area Φ10mm, Output Pulse Logic +TTL, Output Pulse Amplitude 5±0.5V, Output Pulse Width 500±100ns, Background Counting Rate Max. 3 s^-1, Observed Counting Rate 8.8-9k s^-1, 1 Hour Instability Typ. 0.2%
|
|
6-8 weeks |
Request for quote |
|
|
|
 |
STM3013
β Detector, Input Voltage +11.5~ + 12.5V, Max Input Current ≤60mA(+12V); ≤10mA(-12V), Effective Area Φ25mm, Output Pulse Llogic TTL, Output Pulse Amplitude 5±0.2V, Output Pulse Width 500±100ns, Background Counting Rate Max. 3 s^-1, Observed Counting Rate 26.5-28k s^-1, 1 Hour Instability Typ. 0.2%
|
|
6-8 weeks |
Request for quote |
|
|
|
 |
STD317-11
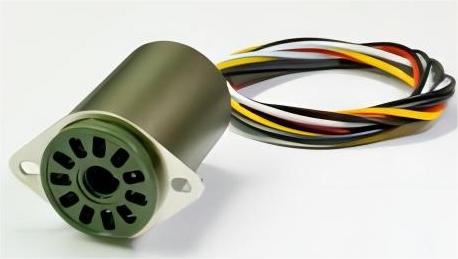
Photomultiplier Tube Accessories - High Voltage Tube Socket for Side Window, Suitable Photomultiplier Tube Side-on PMT, Input Voltage +15±1V, Input Current 80(Max)mA, Output Voltage 0~-1250V, Voltage Control Mode 0~+5V or 50KΩ Potentiometers, Reference Voltage 5.33V, The PMT Outputs A Linear Current Value 180µA(Typ) @-1000V
|
|
6-8 weeks |
Request for quote |
|
|
|
 |
STD701A-14
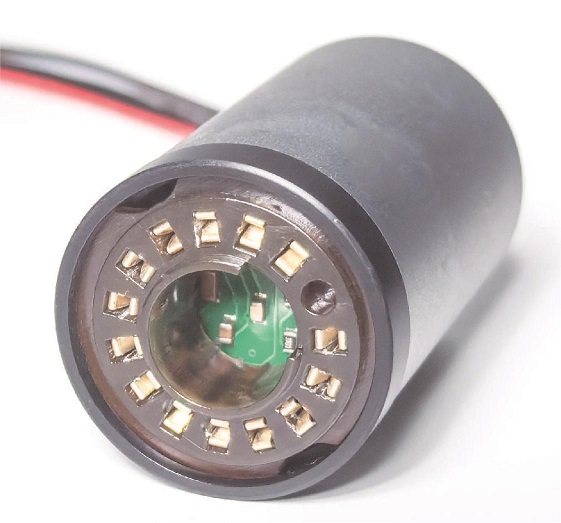
Photomultiplier Tube Accessories - High Voltage Tube Socket, Suitable Photomultiplier Tube Φ28mm End Window Type, Input Voltage ±15V, Input Current Max. VCC 85,VEE 20, -3dBbandwidth Typ. 8MHz, Gain Typ. 0.3V/μA(Load Impedance1 MΩ), Output Signal Bias Typ. 10mV, Output Signal Noise/Ripple Max. 10mV
|
|
6-8 weeks |
Request for quote |
|
|
|
 |
STD454-01
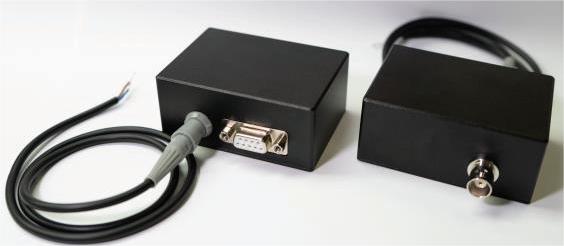
Photomultiplier Tube Accessories - Voltage Power Supply, Input Voltage Range +11.5~+12.5V, Input Current 16mA(Typ), Output Voltage Range 0~-1250V, Ensure Output Voltage Range -200~-1250V, Current Output 0.5mA(Max), Input Regulation 0.01%(Max), Load Regulation 0.01%(Typ)
|
|
6-8 weeks |
Request for quote |
|
|
|
|
STD454-02
Photomultiplier Tube Accessories - Voltage Power Supply, Input Voltage Range +11.5~12.5V, Input Current 16mA(Typ), Output Voltage Range 0~+1250V, Ensure Output Voltage Range 200~+1250V, Current Output 0.5mA(Max), Input Regulation 0.01%(Max), Load Regulation 0.01%(Typ)
|
|
6-8 weeks |
Request for quote |
|
|
|
 |
STM4011
Counting Unit, Input Channel Channel 1, Input Signal Level 3.3VTTL(Compatible with 5VTTL levels), Signal Pulse Width ≥10ns, Input Impedance 50Ω, Count Mode Gating, Maximum Counting Rate 5×10^7S^-1, Maximum Counting Value 232, Gated Time Range 10~655350ms, Pulse Resolution Time 0~255ns
|
|
6-8 weeks |
Request for quote |
|
|
|
 |
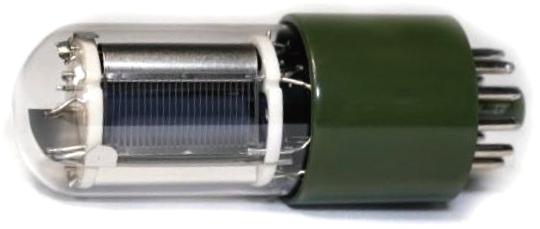
LA-BY01-H1-2002
Spectral Range:290-650 nm ; Peak QE:380 nm ;Gain: Min:1*10^6/Typ:5*10^6 ; Dark Current:Min:1/Typ:15 nA
|
|
4-6week |
Request for quote |
|
|
|
 |
LA-BY01-H1-2016
Spectral Range:290-650 nm ; Peak QE:380 nm ;Gain:Typ:4*10^6 ; Dark Current:Typ:2/Max:10 nA
|
|
4-6week |
Request for quote |
|
|
|
 |
LA-BY01-H1-2017
Spectral Range:290-650 nm ; Peak QE:380 nm ;Gain:Typ:7*10^6 ; Dark Current:Typ:3/Max:20 nA
|
|
4-6week |
Request for quote |
|
|
|
 |
LA-BY01-H1-2018
Spectral Range:290-650 nm ; Peak QE:380 nm ;Gain:Typ:5*10^5(@25℃) ; Dark Current:Typ:0.1(@25℃) /Max:10(@25℃)/Max:1000(@175℃)nA
|
|
4-6week |
Request for quote |
|
|
|
 |
LA-BY01-H1-2021
Spectral Range:290-650 nm ; Peak QE:380 nm;Gain:Typ:1*10^5 ; Dark Current:Typ:5/Max:10 nA
|
|
4-6week |
Request for quote |
|
|
|
 |
LA-BY01-H2-2013-A
Spectral Range:290-650 nm ; Peak QE:380 nm;Gain: Min:Typ:7*10^6 ; Dark Count Rate:Max:140 Hz ; Dark Current:Typ:2/Max:10 nA
|
|
4-6week |
Request for quote |
|
|
|
|
LA-BY01-H2-2013-B
Spectral Range:290-650 nm ; Peak QE:380 nm ; Gain: Min:Typ:7*10^6 ; Dark Count Rate:Max:140 Hz ; Dark Current:Typ:2/Max:10 nA
|
|
4-6week |
Request for quote |
|
|
|
|
LA-BY01-H2-2013-C
Spectral Range:290-650 nm ; Peak QE:380 nm;Gain: Min:Typ:7*10^6 ; Dark Count Rate:Max:1000 Hz ; Dark Current:Typ:2/Max:10
|
|
4-6week |
Request for quote |
|
|
|
|
LA-BY01-Tube-S2-08
Spectral range:300-650nm;Photocathode Luminous Sensitivity:Min 50 μA/lm(Typ:70μA/lm); Anode Luminous Sensitivity:Min 1000A/lm(Typ:1400A/lm); Gain:2*10^7; Dark current:Typ:3nA(Max:7nA)
|
|
6-8 weeks |
Request for quote |
|
|
|
|
LA-BY01-Tube-S2-09
Spectral range:300-650nm;Photocathode Luminous Sensitivity:Min 25μA/lm(Typ:50μA/lm); Anode Luminous Sensitivity:Min 200A/lm(Typ:500A/lm); Gain:1*10^7; Dark current:Typ:3nA(Max:7nA)
|
|
6-8 weeks |
Request for quote |
|
|
|
|
LA-BY01-H2-2014-A
Spectral Range:290-650 nm ; Peak QE:380 nm ; Anode Sensitivity:Min:400;Dark Count Rate:Max:100 ; Dark Current:3nA
|
|
4-6week |
Request for quote |
|
|
|
|
LA-BY01-H2-2014-B
Spectral Range:290-650 nm ; Peak QE:380 nm ; Anode Sensitivity:Min:200 ;Dark Count Rate:Max:500 ; Dark Current:5nA
|
|
4-6week |
Request for quote |
|
|
|
|
LA-BY01-H2-2014-C1
Spectral Range:290-650 nm ; Peak QE:380 nm ; Anode Sensitivity:Min:300/Typ:800 ;Dark Current:10nA
|
|
4-6week |
Request for quote |
|
|
|
|
LA-BY01-H2-2014-C2
Spectral Range:290-650 nm ; Peak QE:380 nm ; Anode Sensitivity:Min:100 ;Dark Current:30nA
|
|
4-6week |
Request for quote |
|
|
|
|
LA-BY01-H2-2014-D
Spectral Range:290-650 nm ; Peak QE:380 nm ; Anode Sensitivity:Min:50 ;Dark Current:30nA
|
|
4-6week |
Request for quote |
|
|
|
 |
LA-BY01-H3-4021A
Spectral Range:290-650 nm ; Peak QE:380 nm ;Gain:Typ:2.5*10^7 ; Dark Current :Max:30nA
|
|
4-6week |
Request for quote |
|
|
|
|
LA-BY01-H3-4021B
Spectral Range:290-650 nm ; Peak QE:380 nm ;Gain:Typ:1.6*10^7 ; Dark Current :Max:50nA
|
|
4-6week |
Request for quote |
|
|
|
|
LA-BY01-H3-4021C
Spectral Range:290-650 nm ; Peak QE:380 nm ;Gain:Typ:1*10^7 ; Dark Current :Max:100nA
|
|
4-6week |
Request for quote |
|
|
|
 |
LA-BY01-H3-4022
Spectral Range:290-650 nm ; Peak QE:420 nm ;Blue Sensitivity:Min :8/Typ:10μA/lmf;Gain:Typ:2.73*10^5 ; Dark Current :Typ:2/Max:30
|
|
4-6week |
Request for quote |
|
|
|
 |
LA-BY01-H3-4031
Spectral Range:290-650 nm ; Peak QE:420 nm ;Blue Sensitivity:Min :10/Typ:11.5μA/lmf;Gain:Typ:2.73*10^5 ; Dark Current :Typ:2/Max:30nA
|
|
4-6week |
Request for quote |
|
|
|
 |
LA-BY01-H4-2031
Spectral Range:290-650 nm ; QE@410nm:Typ:28%;QE@450nm:Typ:28%;Gain:Typ:1*10^7 ; Dark Count Rate:Typ:1500/Max:3000 Hz
|
|
4-6week |
Request for quote |
|
|
|
 |
LA-BY01-H4-2041
Spectral Range:290-650 nm ; QE@410nm:Min:25/Typ:28%;Top Detection Eff.:Min:22%/Typ:24% ;Top Collection Eff.:Typ:90%;ain:Typ:5*10^6 ; Dark Count Rate:Max:1000 Hz
|
|
4-6week |
Request for quote |
|
|
|
|
SIM-PMT-GAP-660
Detection area:Ø5mm;wavelength range:300~840nm;peak wavelength:660nm;dark current:3nA;Cathode radiation sensitivity:133mA/W,Cathode quantum efficiency:25%;Anodic radiation sensitivity:1.3*10^5A/W;gain:9.8*10^5
|
|
16-18 weeks |
$6487.00 |
|