Near Infrared Spectrometer 900-2500nm
| Compare |
Model |
|
Drawings & Specs |
Availability |
Reference Price
(USD) |
|
|
|
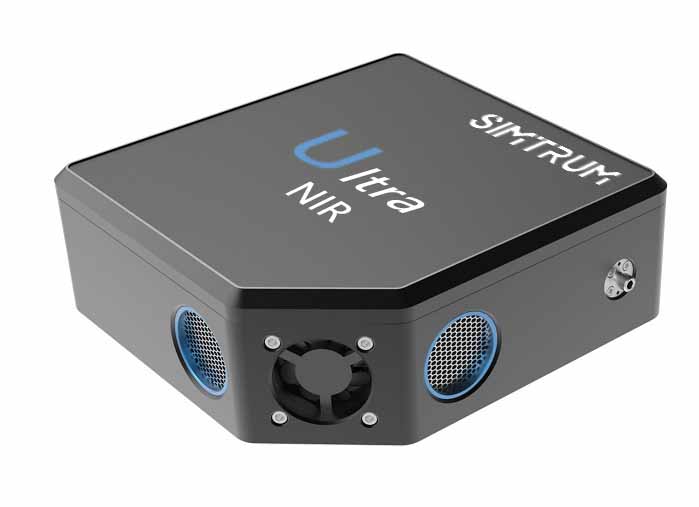 |
LA-Ultra-NIR-F/2-2200
Wavelength Range:900~2200nm,NA:F/2,Detector:Cooling InGaAs(-20℃) 512pixels,SNR:1500:01,Dynamic range:14000:1
|
|
8-10 Weeks |
Request for quote |
|
|
|
|
LA-Ultra-NIR-F/2-2500
Wavelength Range:900~2500nm,NA:F/2,Detector:Cooling InGaAs(-20℃) 512pixels,SNR:1500:01,Dynamic range:14000:1
|
|
8-10 Weeks |
Request for quote |
|
|
|
|
LA-Ultra-NIR-F/1-1700
Wavelength Range:900~1700nm,NA:F/1,Detector:Cooling InGaAs(-20℃) 512pixels,SNR:1500:01,Dynamic range:14000:1
|
|
6-8 Weeks |
Request for quote |
|
|
|
|
LA-Ultra-NIR-F/1-2200
Wavelength Range:900~2200nm,NA:F/1,Detector:Cooling InGaAs(-20℃) 512pixels,SNR:1500:01,Dynamic range:14000:1
|
|
8-10 Weeks |
Request for quote |
|
|
|
|
LA-Ultra-NIR-F/1-2500
Wavelength Range:900~2500nm,NA:F/1,Detector:Cooling InGaAs(-20℃) 512pixels,SNR:1500:01,Dynamic range:14000:1
|
|
8-10 Weeks |
Request for quote |
|
Q-Coli-SM1-SMA-MVA - Parameter
Q-Coli-SM1-SMA - Parameter
LA-Ultra-NIR-F/1-2500 - Parameter
LA-Ultra-NIR-F/1-2200 - Parameter
LA-Ultra-NIR-F/1-1700 - Parameter
LA-Ultra-NIR-F/2-2500 - Parameter
LA-Ultra-NIR-F/2-2200 - Parameter
QP-Y-600-2M-VIS/NIR - Parameter
QP-Y-200-2M-VIS/NIR - Parameter
QP600-01-VIS/NIR - Parameter
QP200-01-VIS/NIR - Parameter
QP100-01-VIS/NIR - Parameter
Q-Coli-SM1-SMA-MVA - Download
Q-Coli-SM1-SMA - Download
LA-Ultra-NIR-F/1-2500 - Download
LA-Ultra-NIR-F/1-2200 - Download
LA-Ultra-NIR-F/1-1700 - Download
LA-Ultra-NIR-F/2-2500 - Download
LA-Ultra-NIR-F/2-2200 - Download
QP-Y-600-2M-VIS/NIR - Download
QP-Y-200-2M-VIS/NIR - Download
QP600-01-VIS/NIR - Download
QP200-01-VIS/NIR - Download
QP100-01-VIS/NIR - Download
Accessories
| Compare |
Model |
|
Drawings & Specs |
Availability |
Reference Price
(USD) |
|
|
|
 |
CETO-X
CETO Multi-Function Cuvette Holder, for Abs., Fluo, Raman Use
|
|
6-8 Weeks |
$539.00 |
|
|
|
|
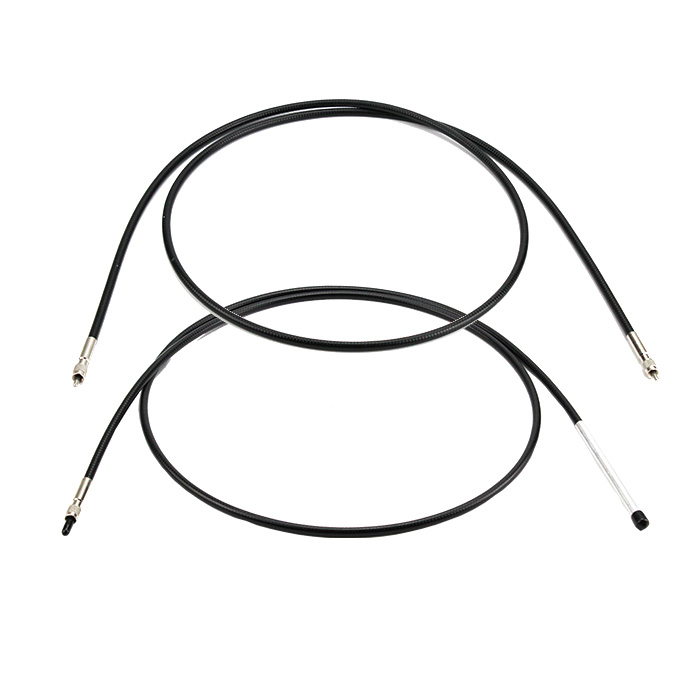
QP100-01-VIS/NIR
100 um Core Diameter, 400~2500 nm, SMA 905 Connectors, 2 meter
|
|
6-8 Weeks |
$141.00 |
|
|
|
|
QP200-01-VIS/NIR
200 um Core Diameter, 400~2500 nm, SMA 905 Connectors, 2 meter
|
|
6-8 Weeks |
$141.00 |
|
|
|
|
QP600-01-VIS/NIR
600 um Core Diameter, 400~2500 nm, SMA 905 Connectors, 2 meter
|
|
6-8 Weeks |
$192.00 |
|
|
|
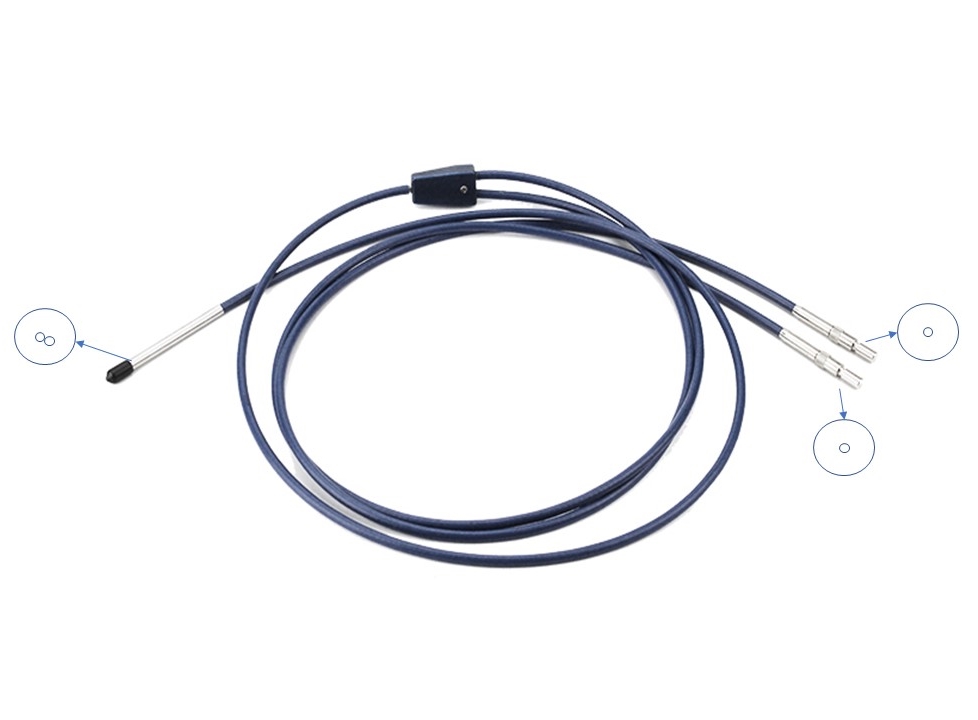 |
QP-Y-200-2M-VIS/NIR
Y-Type Fiber Probe, 200 um Core Diameter, 2 meters, 400-2500nm
|
|
6-8 Weeks |
$282.00 |
|
|
|
|
QP-Y-600-2M-VIS/NIR
Y-Type Fiber Probe, 600 um Core Diameter, 2 meters, 400-2500nm
|
|
6-8 Weeks |
$346.00 |
|
|
|
|
74-UV
UV/VIS Collimating Lens, 200-2000 nm, 5 mm diameter
|
|
6-8 Weeks |
$49.00 |
|
|
|
|
Q-Coli-SM1-SMA
UV/VIS Collimating Lens, SM1 and SMA Connector
|
|
6-8 Weeks |
$257.00 |
|
|
|
|
Q-Coli-SM1-SMA-MVA
UV/VIS Collimating Lens, SM1 and SMA Connector w/ Manual Variable Attenuator
|
|
6-8 Weeks |
$449.00 |
|